Photos | Analyzing Data with a Screen

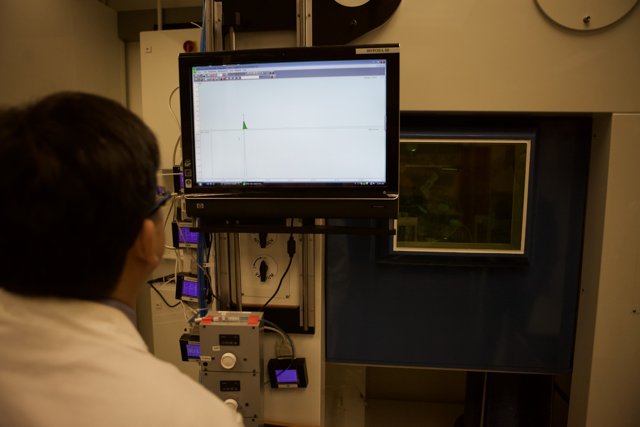
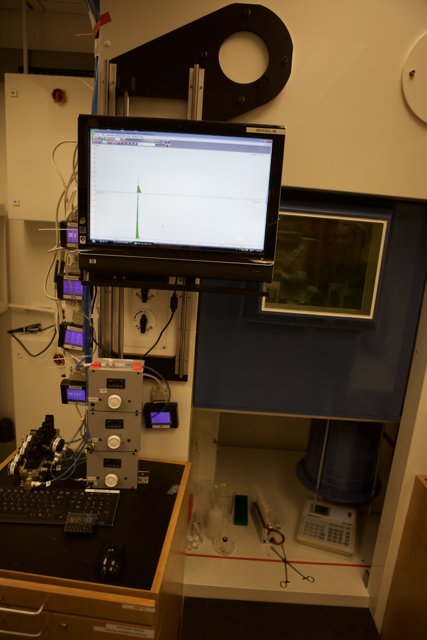
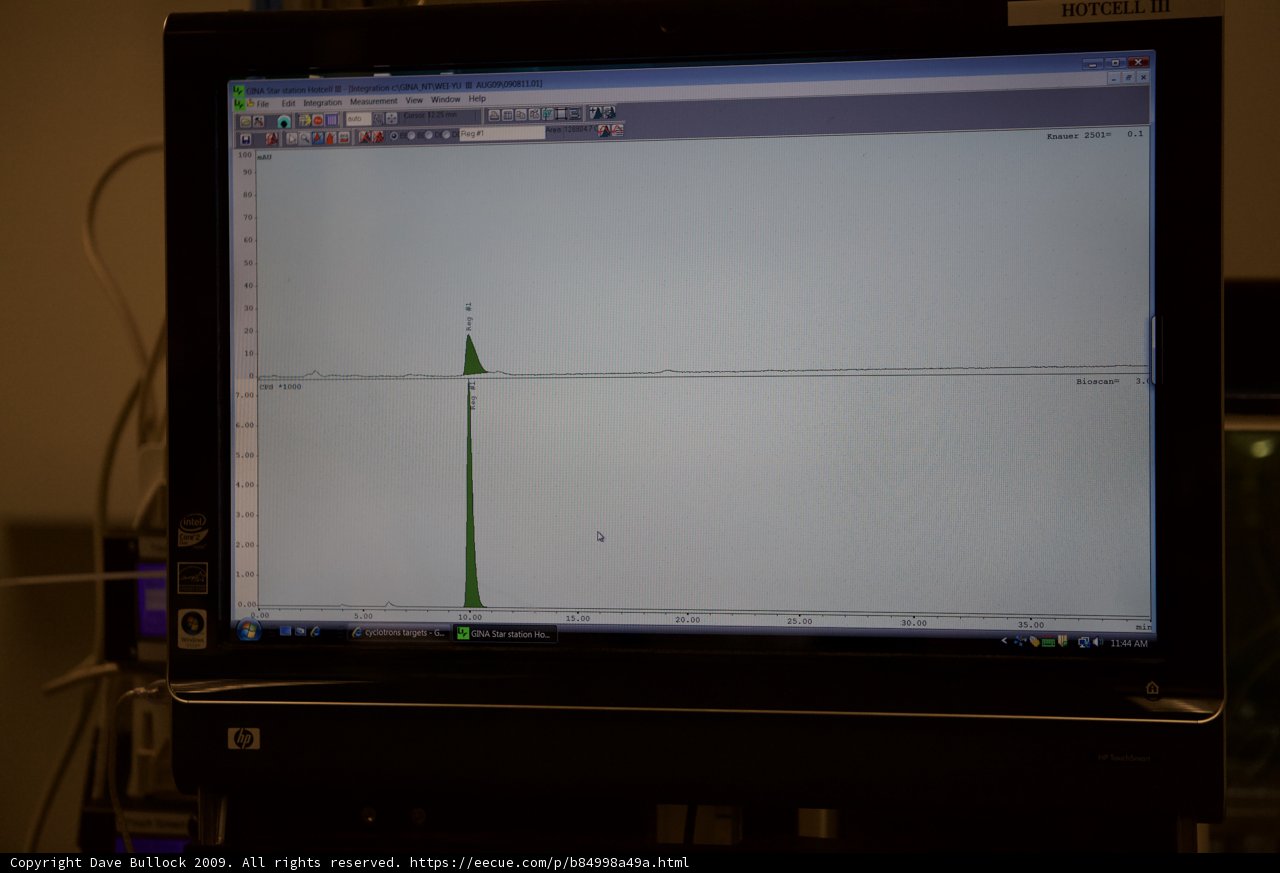
This computer screen displays a line graph from the UCLA Micro Bio Chip project in 2009, showcasing the power of computer hardware and electronics in scientific research.
BLIP-2 Description:
a computer screen showing a line graphMetadata
Capture date:
Original Dimensions:
5616w x 3744h - (download 4k)
Usage
Dominant Color:
Detected Text
iso
1600
metering mode
5
aperture
f/2.8
focal length
60mm
shutter speed
1/2000s
camera make
Canon
camera model
lens model
date
2009-08-13T11:41:45.420000-07:00
tzoffset
-25200
tzname
America/Los_Angeles
overall
(33.86%)
curation
(25.00%)
highlight visibility
(1.99%)
behavioral
(10.15%)
failure
(-0.68%)
harmonious color
(2.11%)
immersiveness
(0.51%)
interaction
(1.00%)
interesting subject
(-57.13%)
intrusive object presence
(-5.37%)
lively color
(-20.54%)
low light
(33.57%)
noise
(-2.59%)
pleasant camera tilt
(-9.12%)
pleasant composition
(1.76%)
pleasant lighting
(-28.98%)
pleasant pattern
(3.69%)
pleasant perspective
(15.03%)
pleasant post processing
(9.91%)
pleasant reflection
(-7.98%)
pleasant symmetry
(3.69%)
sharply focused subject
(1.93%)
tastefully blurred
(12.61%)
well chosen subject
(-2.80%)
well framed subject
(48.10%)
well timed shot
(6.36%)
all
(1.91%)
* WARNING: The title and caption of this image were generated by an AI LLM (gpt-3.5-turbo-0301
from
OpenAI)
based on a
BLIP-2 image-to-text labeling, tags,
location,
people
and album metadata from the image and are
potentially inaccurate, often hilariously so. If you'd like me to adjust anything,
just reach out.