Photos | 
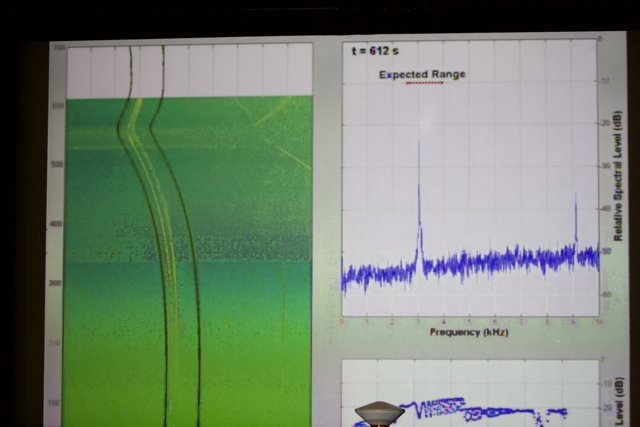
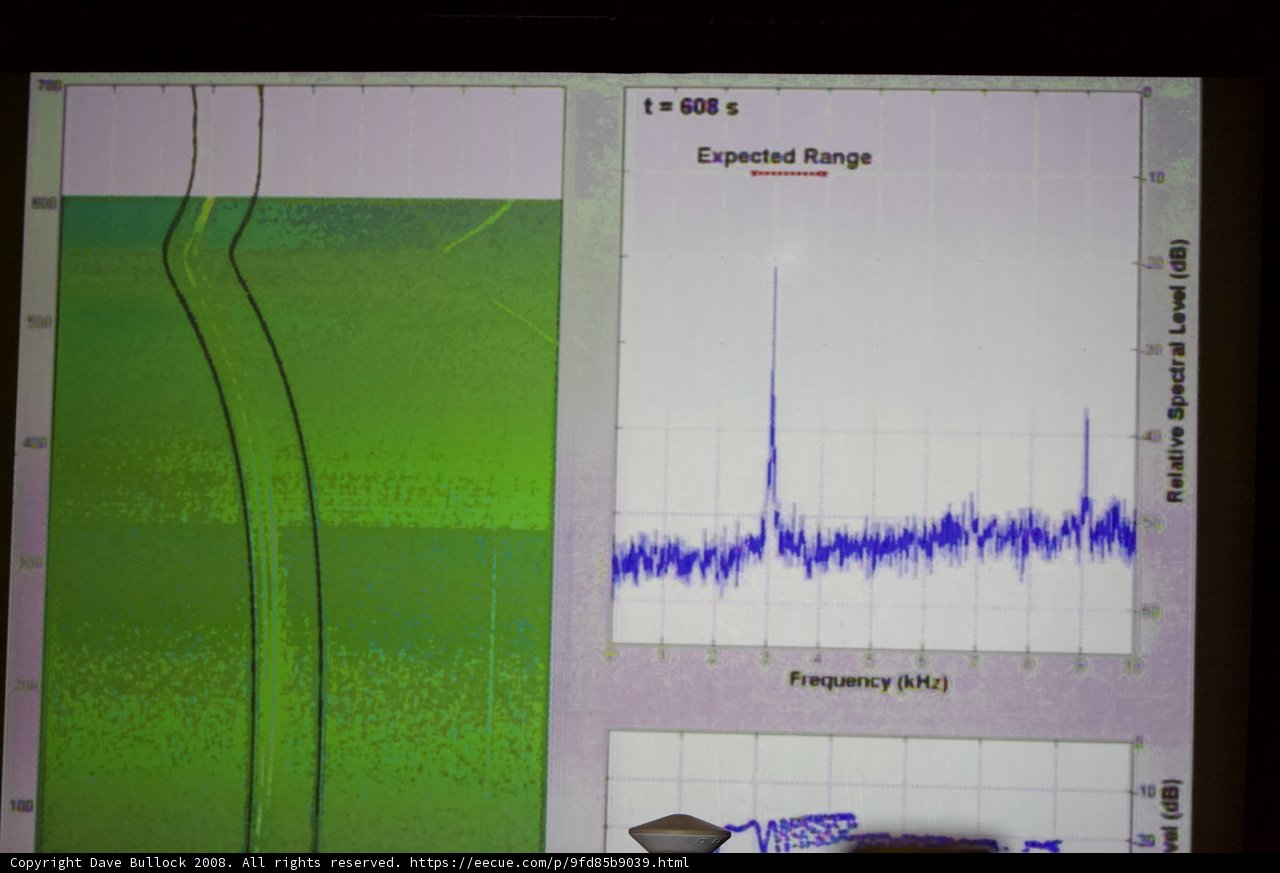
Waveform Chart Shown on Monitor

This electronics document shows a detailed chart of a wave on a computer hardware monitor, captured by an oscilloscope. Taken during the Phoenix touchdown in 2008.
BLIP-2 Description:
a screen showing a graph of a waveMetadata
Capture date:
Original Dimensions:
3888w x 2592h - (download 4k)
Usage
Dominant Color:
iso
1600
metering mode
5
aperture
f/2.8
focal length
80mm
shutter speed
1/640s
camera make
Canon
camera model
lens model
date
2008-05-25T16:48:32.010000-07:00
tzoffset
-25200
tzname
America/Los_Angeles
overall
(7.54%)
curation
(25.00%)
highlight visibility
(1.98%)
behavioral
(10.02%)
failure
(-0.76%)
harmonious color
(-3.20%)
immersiveness
(0.12%)
interaction
(1.00%)
interesting subject
(-84.08%)
intrusive object presence
(-8.91%)
lively color
(-15.21%)
low light
(8.79%)
noise
(-14.36%)
pleasant camera tilt
(-11.63%)
pleasant composition
(-56.20%)
pleasant lighting
(-56.25%)
pleasant pattern
(3.17%)
pleasant perspective
(3.22%)
pleasant post processing
(-1.71%)
pleasant reflection
(-2.97%)
pleasant symmetry
(1.05%)
sharply focused subject
(0.34%)
tastefully blurred
(-3.30%)
well chosen subject
(-3.21%)
well framed subject
(2.82%)
well timed shot
(5.44%)
all
(-8.76%)
* WARNING: The title and caption of this image were generated by an AI LLM (gpt-3.5-turbo-0301
from
OpenAI)
based on a
BLIP-2 image-to-text labeling, tags,
location,
people
and album metadata from the image and are
potentially inaccurate, often hilariously so. If you'd like me to adjust anything,
just reach out.