Photos | Data Analysis on Computer Screen

Data Analysis on Computer Screen

Caption

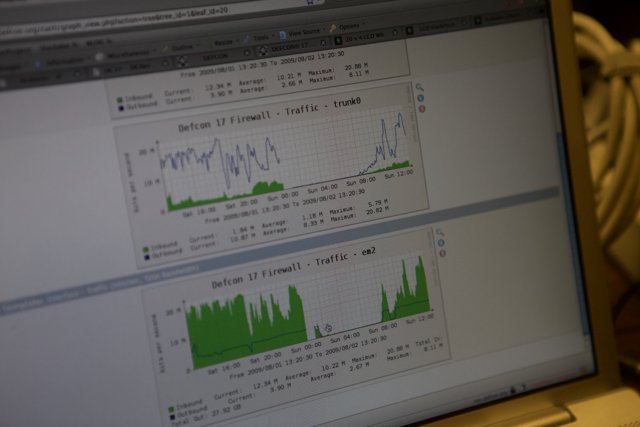
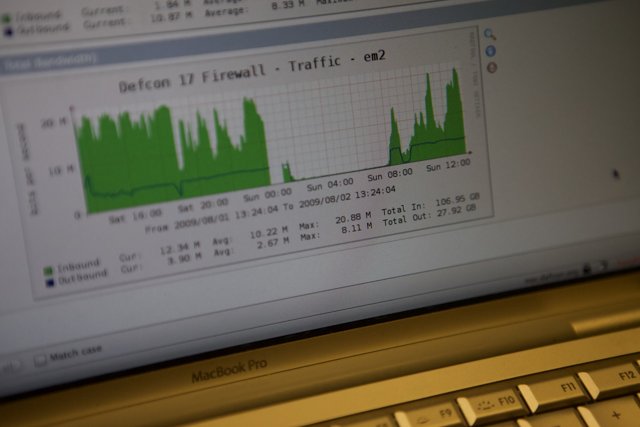
A graph showing analyzed data on a computer screen during Defcon 17 in 2009.

BLIP-2 Description:

a computer screen showing a graph of data

Chronologically Adjacent

Previous chronologically
Next chronologically
Note: You can also navigate with your arrow keys or swiping.

Metadata

Original Dimensions:

5616w x 3744h - (download 4k)

Dominant Color:

Detected Text

00  02  04  06  08  1  10  10.17  10.22  10m  12  12.34  14  17  17.75  18  2.67  20  20.88  20.99  22  27  27.92  28  29  3.75  3.90  30  31  5  8.17  average  bound  cb  current  daily  defcon  e  em2  firewall  in  m  maximum  minute  miscellaneous  out  tatal  total  traffic    
iso
1600
metering mode
5
aperture
f/2.8
focal length
70mm
shutter speed
1/640s
camera make
Canon
camera model
date
2009-08-02T13:21:51.290000-07:00
tzoffset
-25200
tzname
America/Los_Angeles
* WARNING: The title and caption of this image were generated by an AI LLM (gpt-3.5-turbo-0301 from OpenAI) based on a BLIP-2 image-to-text labeling, tags, location, people and album metadata from the image and are potentially inaccurate, often hilariously so. If you'd like me to adjust anything, just reach out.