Photos | 
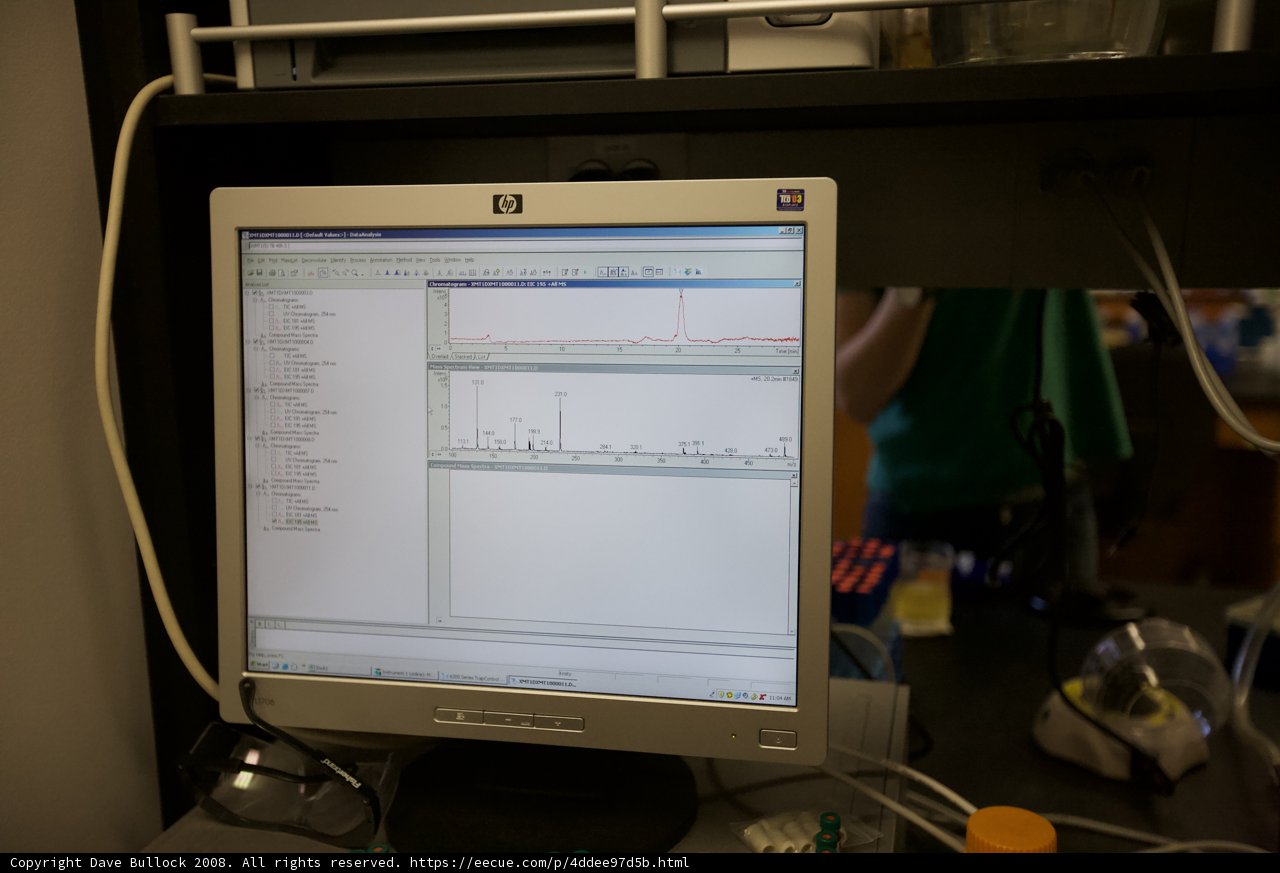
Computer Monitor Displaying Graph Data

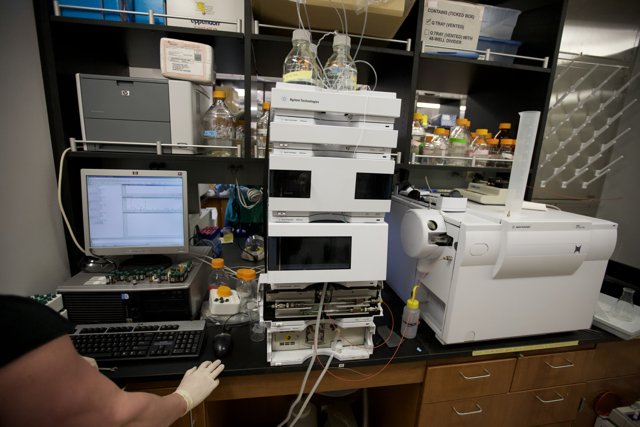
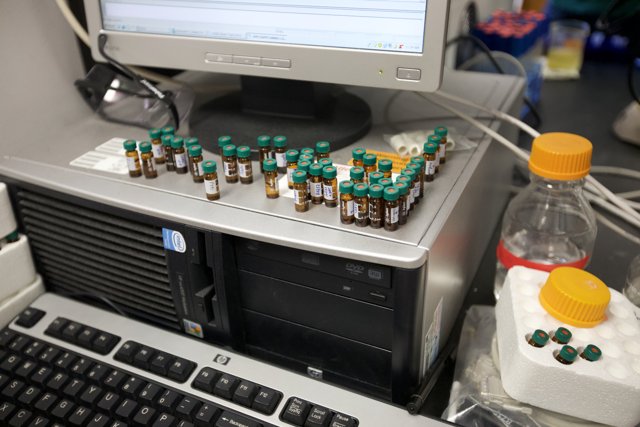
A computer monitor on a desk displaying a graph with data from the 2008 Caltech yeast experiment.
BLIP-2 Description:
a computer monitor with a graph on itMetadata
Capture date:
Original Dimensions:
4368w x 2912h - (download 4k)
Usage
iso
1600
metering mode
5
aperture
f/2.8
focal length
35mm
shutter speed
1/800s
camera make
Canon
camera model
lens model
date
2008-08-20T11:07:16-07:00
tzoffset
-25200
tzname
America/Los_Angeles
overall
(18.49%)
curation
(25.00%)
highlight visibility
(2.44%)
behavioral
(70.32%)
failure
(-0.54%)
harmonious color
(-2.19%)
immersiveness
(0.10%)
interaction
(1.00%)
interesting subject
(-85.69%)
intrusive object presence
(-7.18%)
lively color
(-13.23%)
low light
(16.94%)
noise
(-0.66%)
pleasant camera tilt
(-8.22%)
pleasant composition
(-78.96%)
pleasant lighting
(-38.92%)
pleasant pattern
(1.00%)
pleasant perspective
(-0.59%)
pleasant post processing
(3.51%)
pleasant reflection
(-5.22%)
pleasant symmetry
(0.42%)
sharply focused subject
(1.42%)
tastefully blurred
(-5.96%)
well chosen subject
(-4.28%)
well framed subject
(14.50%)
well timed shot
(-2.04%)
all
(-8.52%)
* WARNING: The title and caption of this image were generated by an AI LLM (gpt-3.5-turbo-0301
from
OpenAI)
based on a
BLIP-2 image-to-text labeling, tags,
location,
people
and album metadata from the image and are
potentially inaccurate, often hilariously so. If you'd like me to adjust anything,
just reach out.