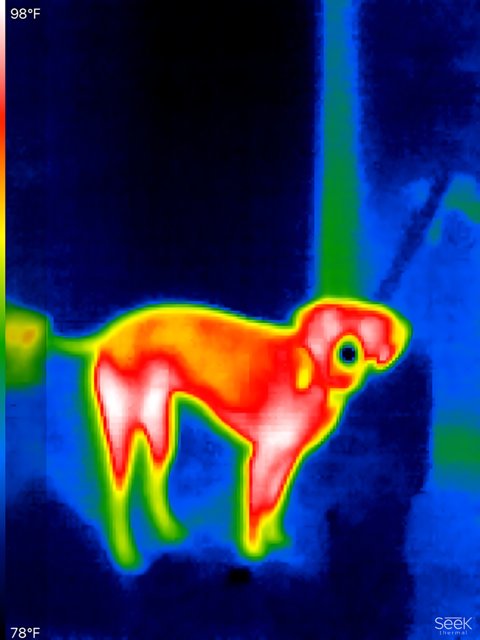
Thermal Imaging Reveals Temperature Distribution Pattern
Thursday, August 27th, 2020 at 8:23:55 PM · 2020/Photos
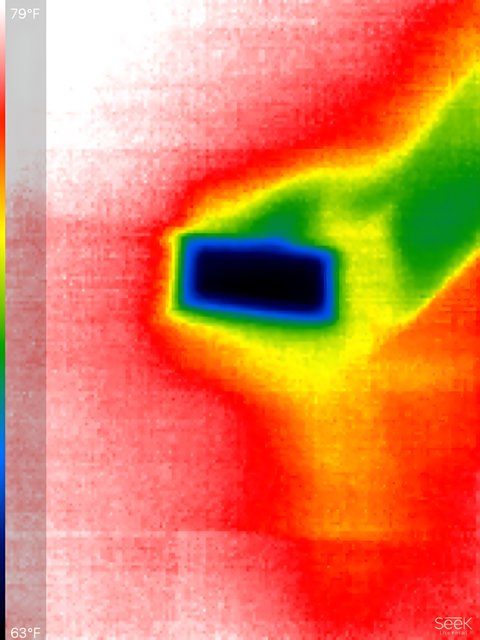
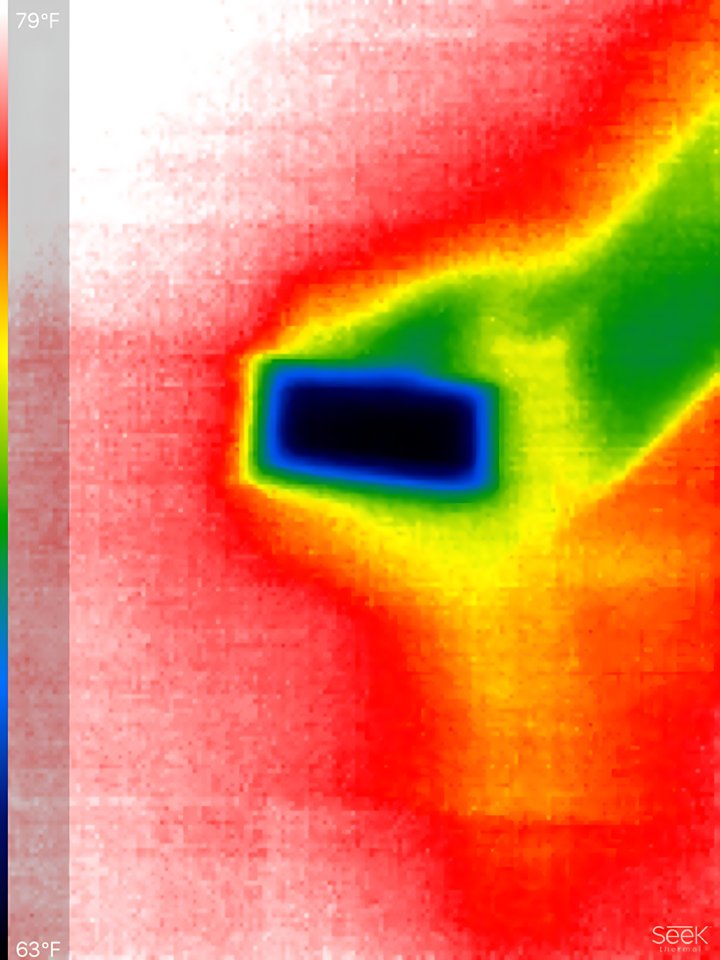
This thermal imaging photograph displays a rainbow-like color gradient representing temperature variations across a surface or area. The image shows temperatures ranging from 63°F (depicted in cooler blues and blacks) to 79°F (shown in warmer reds and whites). A prominent dark oval shape in the center indicates the coldest area, surrounded by concentric bands of increasingly warmer temperatures represented by blue, green, yellow, orange, and red colors. The thermal visualization creates an almost artistic pattern with its vibrant color spectrum.
Chronologically Adjacent