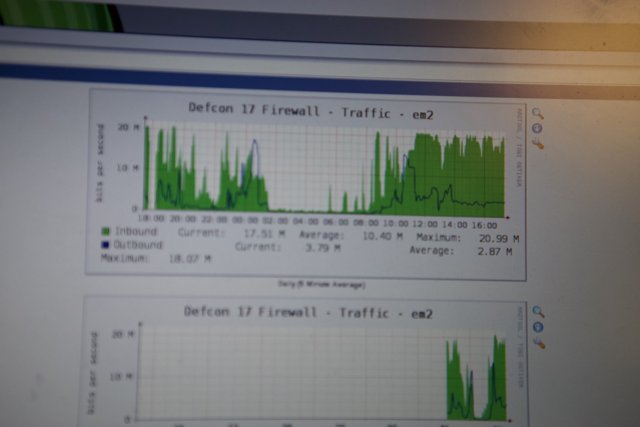
Traffic Graph Analysis at DEFCON 17
Saturday, August 1st, 2009 at 5:30:25 PM · Photo Archive/2009/defcon_17
A computer screen displays a chart documenting traffic data analyzed on a white board during DEFCON 17 in 2009.
Chronologically Adjacent
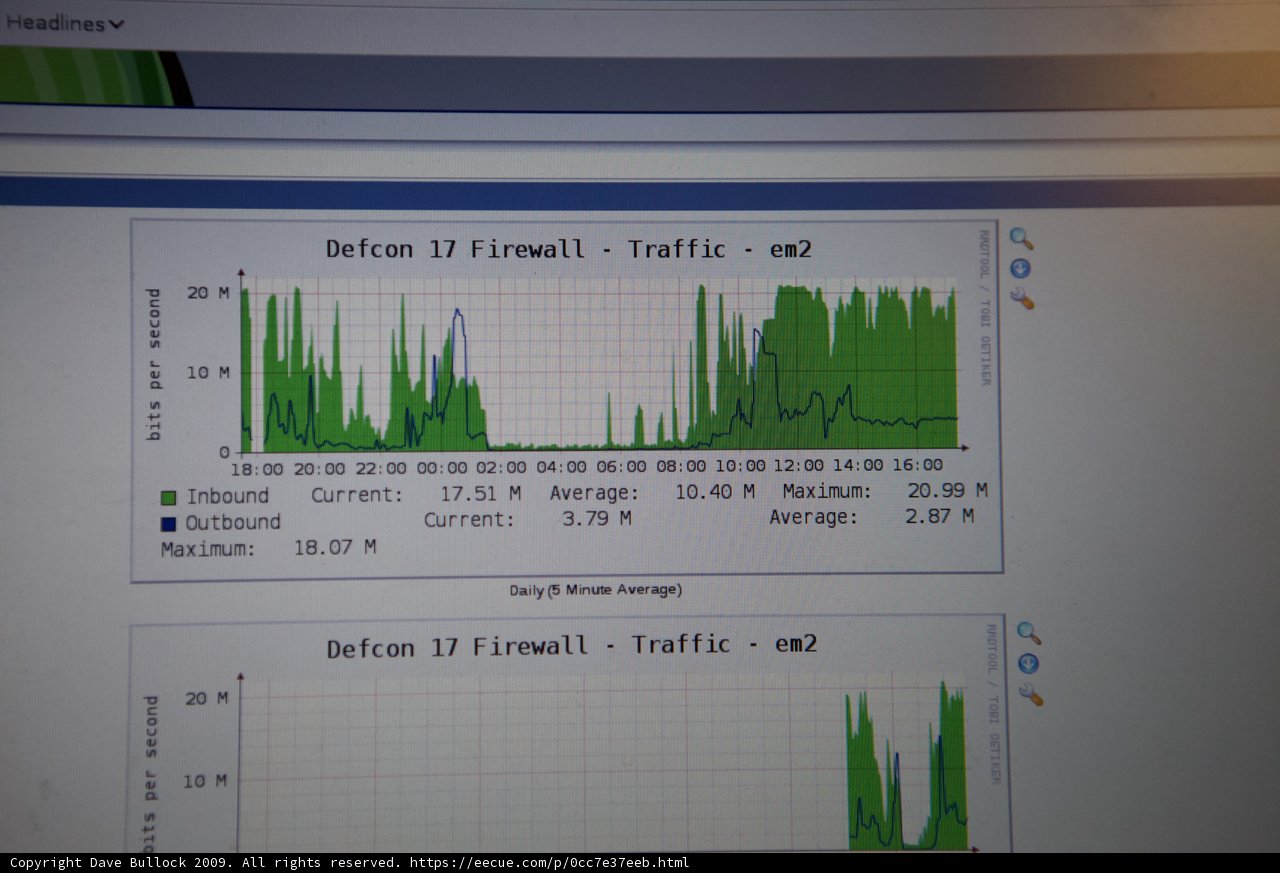
Saturday, August 1st, 2009 at 5:30:25 PM · Photo Archive/2009/defcon_17
A computer screen displays a chart documenting traffic data analyzed on a white board during DEFCON 17 in 2009.
Chronologically Adjacent