Photos | Analyzing Performance

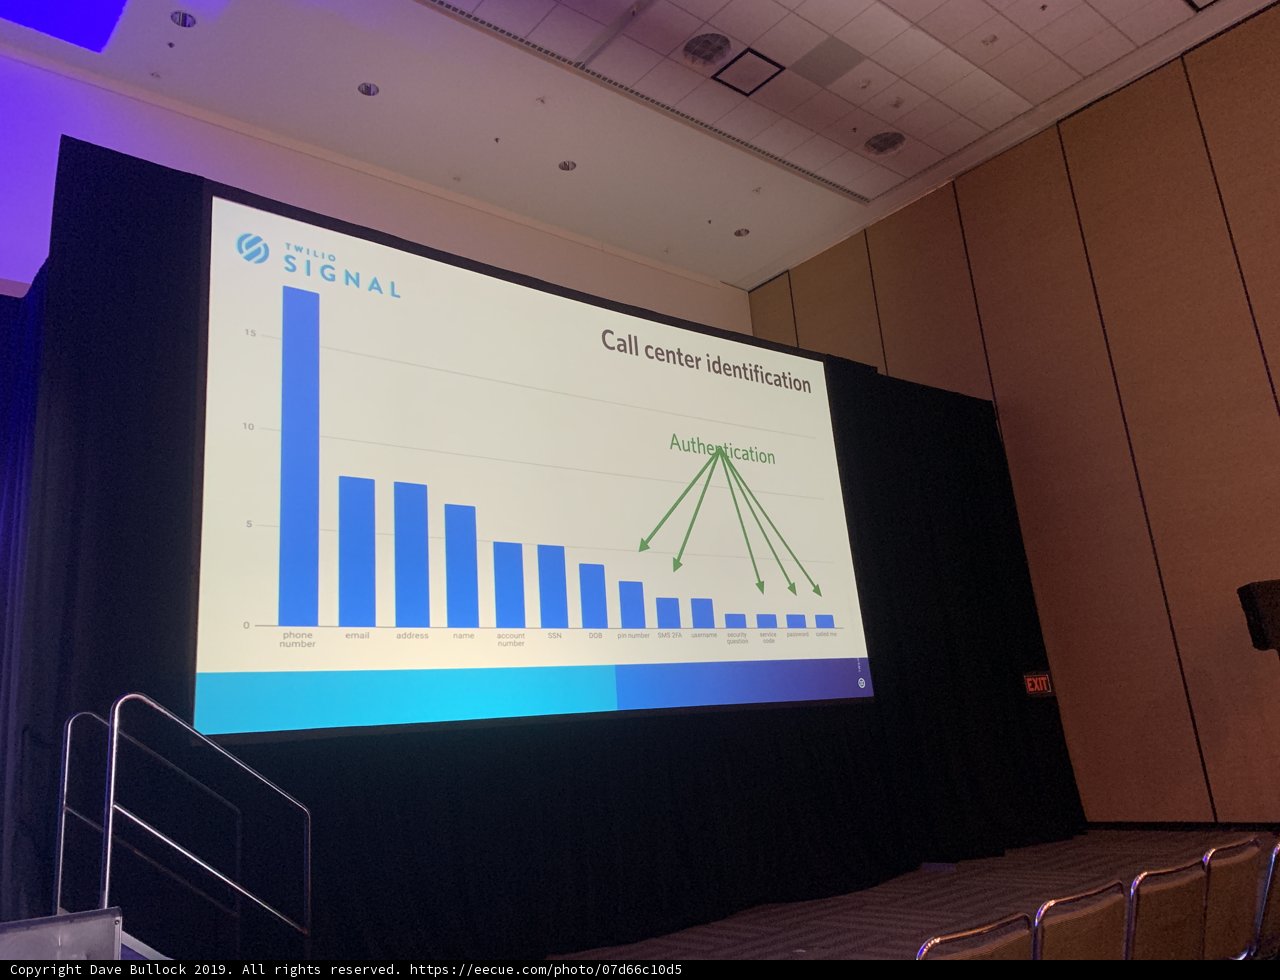
A close-up of a projection screen displaying a detailed bar chart during a presentation in an auditorium in San Francisco in 2019.
BLIP-2 Description:
a screen showing a graph on a stageMetadata
Capture date:
Original Dimensions:
4032w x 3024h - (download 4k)
Usage
Dominant Color:
Location:
Detected Text
iso
400
metering mode
5
aperture
f/1.8
focal length
4mm
latitude
37.78
longitude
-122.4
shutter speed
1/60s
camera make
Apple
camera model
lens model
date
2019-08-07T17:03:35.971000-07:00
tzoffset
-25200
tzname
America/Los_Angeles
overall
(28.00%)
curation
(50.00%)
highlight visibility
(2.45%)
behavioral
(70.36%)
failure
(-0.44%)
harmonious color
(0.04%)
immersiveness
(0.59%)
interaction
(1.00%)
interesting subject
(-59.08%)
intrusive object presence
(-5.32%)
lively color
(-12.50%)
low light
(5.91%)
noise
(-4.10%)
pleasant camera tilt
(-11.55%)
pleasant composition
(-39.01%)
pleasant lighting
(-29.44%)
pleasant pattern
(11.30%)
pleasant perspective
(-12.92%)
pleasant post processing
(-2.09%)
pleasant reflection
(0.03%)
pleasant symmetry
(0.85%)
sharply focused subject
(0.44%)
tastefully blurred
(9.89%)
well chosen subject
(-15.00%)
well framed subject
(-9.16%)
well timed shot
(-2.44%)
all
(-4.83%)
* WARNING: The title and caption of this image were generated by an AI LLM (gpt-3.5-turbo-0301
from
OpenAI)
based on a
BLIP-2 image-to-text labeling, tags,
location,
people
and album metadata from the image and are
potentially inaccurate, often hilariously so. If you'd like me to adjust anything,
just reach out.