Photos | 
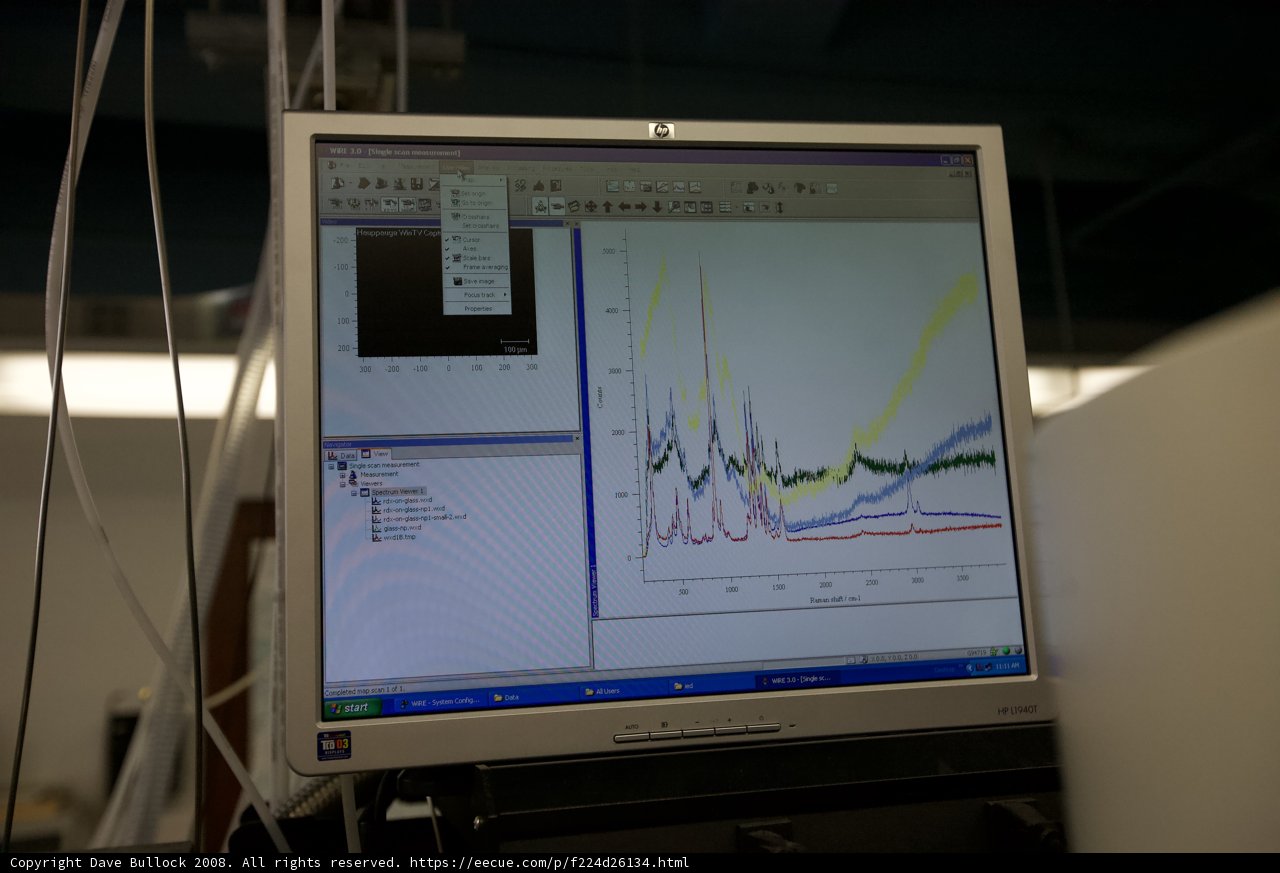
Analyzing Data on a Computer Monitor

A computer monitor displaying a graph of data for analysis, showcasing the advanced technology of electronics and computer hardware.
BLIP-2 Description:
a computer monitor displaying a graph of dataMetadata
Capture date:
Original Dimensions:
4368w x 2912h - (download 4k)
Usage
Dominant Color:
caltech_nano_still machine config caltech count furniture hp viewer spectrum hy 密 laptop nano qax hardware consumer shit screen still chart tv pc view 囚 图 sale measurement 目 vh weoign citi completed monitor hauppauge 藏区 wxolb system wire map keyboard winty table single scan computer capt raman start data set crosshairs measurementi electronics document bars
Detected Text
iso
1600
metering mode
5
aperture
f/4
exposure bias
-0.67
focal length
35mm
shutter speed
1/1000s
camera make
Canon
camera model
lens model
date
2008-04-17T09:59:59-07:00
tzoffset
-25200
tzname
America/Los_Angeles
overall
(17.72%)
curation
(25.00%)
highlight visibility
(1.99%)
behavioral
(10.15%)
failure
(-0.85%)
harmonious color
(-0.35%)
immersiveness
(0.15%)
interaction
(1.00%)
interesting subject
(-75.34%)
intrusive object presence
(-19.53%)
lively color
(-5.81%)
low light
(17.24%)
noise
(-3.52%)
pleasant camera tilt
(-10.30%)
pleasant composition
(-40.80%)
pleasant lighting
(-43.07%)
pleasant pattern
(2.86%)
pleasant perspective
(-3.83%)
pleasant post processing
(3.27%)
pleasant reflection
(-9.91%)
pleasant symmetry
(1.07%)
sharply focused subject
(1.68%)
tastefully blurred
(13.87%)
well chosen subject
(-6.95%)
well framed subject
(34.74%)
well timed shot
(-3.35%)
all
(-6.35%)
* WARNING: The title and caption of this image were generated by an AI LLM (gpt-3.5-turbo-0301
from
OpenAI)
based on a
BLIP-2 image-to-text labeling, tags,
location,
people
and album metadata from the image and are
potentially inaccurate, often hilariously so. If you'd like me to adjust anything,
just reach out.