Photos | 
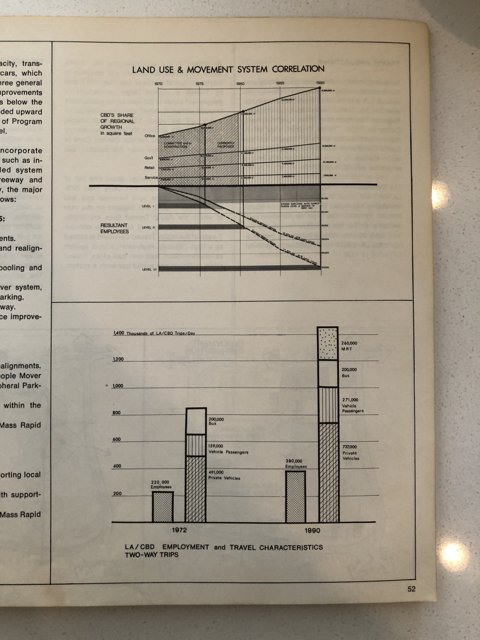
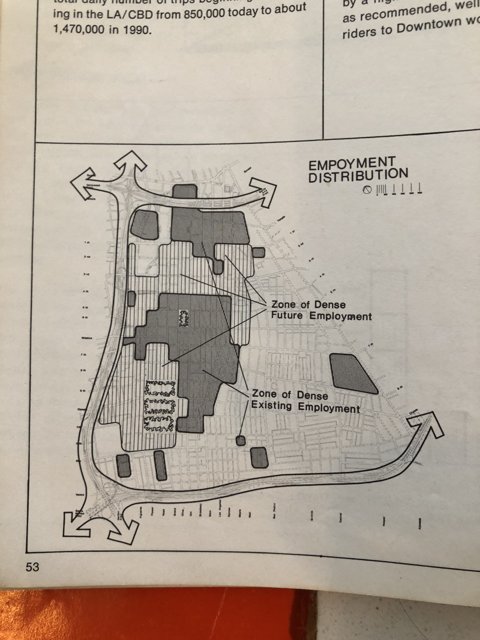
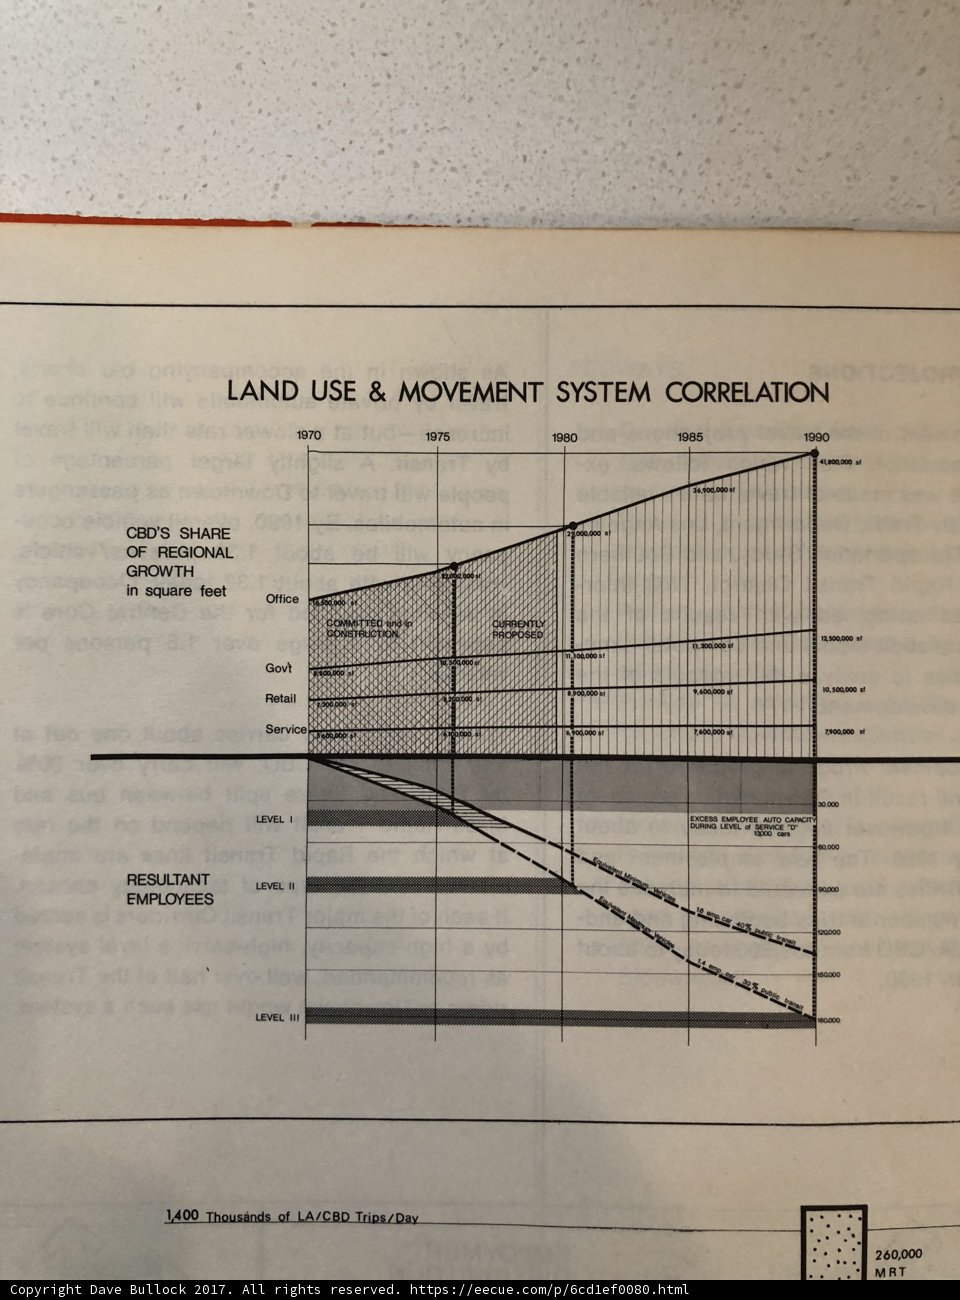
Comparing Land Use and Movement Systems
This printed chart documents the different plans, plots, and diagrams used to compare land use and movement systems in 2017.
BLIP-2 Description:
land use and movement system comparisonMetadata
Capture date:
Original Dimensions:
3024w x 4032h - (download 4k)
Usage
Dominant Color:
Detected Text
1,400 11 11,300,000 12,500,000 18 19000 1970 1975 1980 1985 1990 260,000 29,000,000 30.000 36,900.000 41,800,000 6,900,000 7,600,000 7,900,000 9,600,000 auto capaciti car cbd cbd's constructio correlation currently day during emp employee employees excess f feet growth i iii in la land level movement of office proposed regional resultant retail s service sf share square st system thousands trips use саго
iso
40
metering mode
5
aperture
f/1.8
focal length
4mm
shutter speed
1/15s
camera make
Apple
camera model
lens model
date
2017-12-02T12:45:25.106000-08:00
tzoffset
-28800
tzname
America/Los_Angeles
overall
(10.28%)
curation
(25.00%)
highlight visibility
(1.99%)
behavioral
(10.08%)
failure
(-0.71%)
harmonious color
(1.37%)
immersiveness
(0.29%)
interaction
(1.00%)
interesting subject
(-81.10%)
intrusive object presence
(-2.76%)
lively color
(7.35%)
low light
(0.22%)
noise
(-6.74%)
pleasant camera tilt
(-7.67%)
pleasant composition
(-8.33%)
pleasant lighting
(5.63%)
pleasant pattern
(4.88%)
pleasant perspective
(6.67%)
pleasant post processing
(2.51%)
pleasant reflection
(-6.55%)
pleasant symmetry
(0.95%)
sharply focused subject
(1.78%)
tastefully blurred
(4.98%)
well chosen subject
(19.95%)
well framed subject
(3.49%)
well timed shot
(5.62%)
all
(3.03%)
* WARNING: The title and caption of this image were generated by an AI LLM (gpt-3.5-turbo-0301
from
OpenAI)
based on a
BLIP-2 image-to-text labeling, tags,
location,
people
and album metadata from the image and are
potentially inaccurate, often hilariously so. If you'd like me to adjust anything,
just reach out.