Photos | Analyzing Data Trends

Analyzing Data Trends

Caption

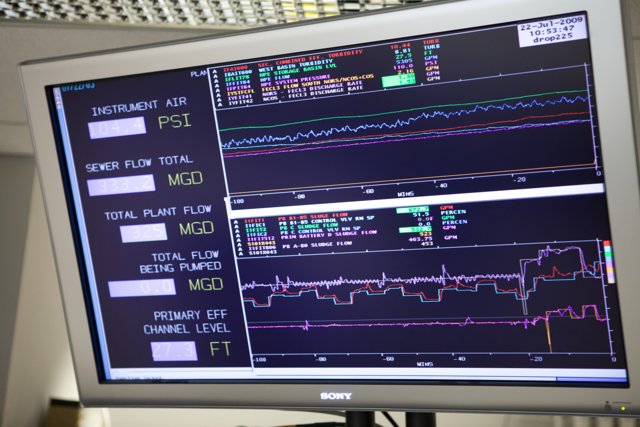
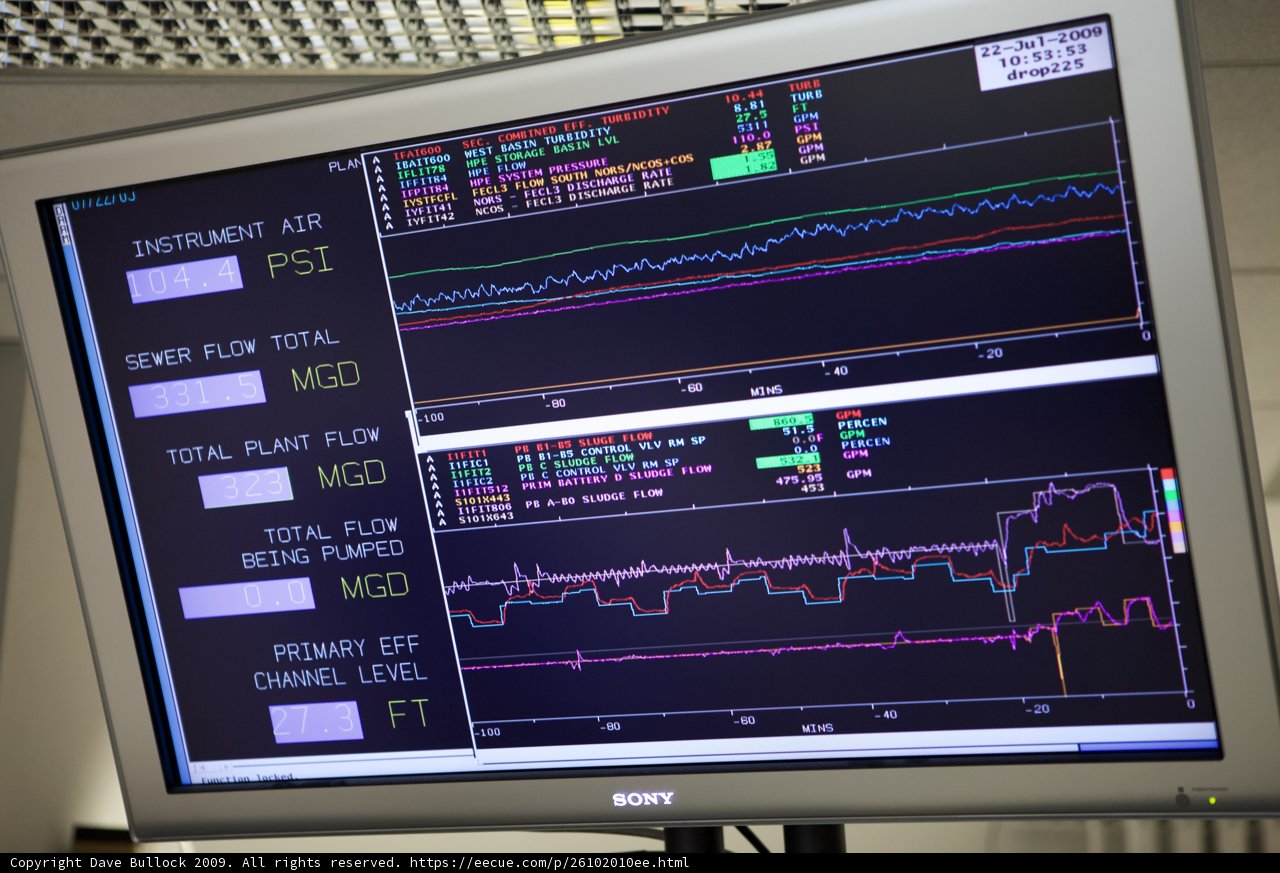
This computer monitor displays a detailed graph, providing insights into data trends and analysis in 2009. #chart #computer #technology #dataanalysis

BLIP-2 Description:

a computer monitor with a graph on it

Chronologically Adjacent

Previous chronologically
Next chronologically
Note: You can also navigate with your arrow keys or swiping.

Metadata

Original Dimensions:

5616w x 3744h - (download 4k)

Detected Text

0  0.0  10  10.44  100  104  110.0  2.87  20  2009  22  27  323  331  40  453  475.95  5101x443  523  53  5311  60  8.81  80  a  aaaaaa  air  bas  basin  battery  being  bidity  bo  channel  combined  control  discharge  drop225  eff  flow  in  instrument  level  mins  nors  of  pb  percen  plan  plant  pressure  prim  primary  psi  pumped  rate  s101x643  sec  sewer  sludge  sluge  sony  south  sp  storage  system  total  tur  turb  turbidity  ture  west  วัน1    
iso
1600
metering mode
5
aperture
f/2.8
exposure bias
-0.32999999999999996
focal length
70mm
shutter speed
1/50s
camera make
Canon
camera model
date
2009-07-22T10:56:46.630000-07:00
tzoffset
-25200
tzname
America/Los_Angeles
* WARNING: The title and caption of this image were generated by an AI LLM (gpt-3.5-turbo-0301 from OpenAI) based on a BLIP-2 image-to-text labeling, tags, location, people and album metadata from the image and are potentially inaccurate, often hilariously so. If you'd like me to adjust anything, just reach out.